Know where to intervene
Vegetation percentages and maps show where grass encroachment or saplings need attention, helping you deploy people and budget effectively.

Service 02 · Vegetation analysis
See where grass encroachment and saplings are increasing, track management effects and support your next decision.
Why we analyse
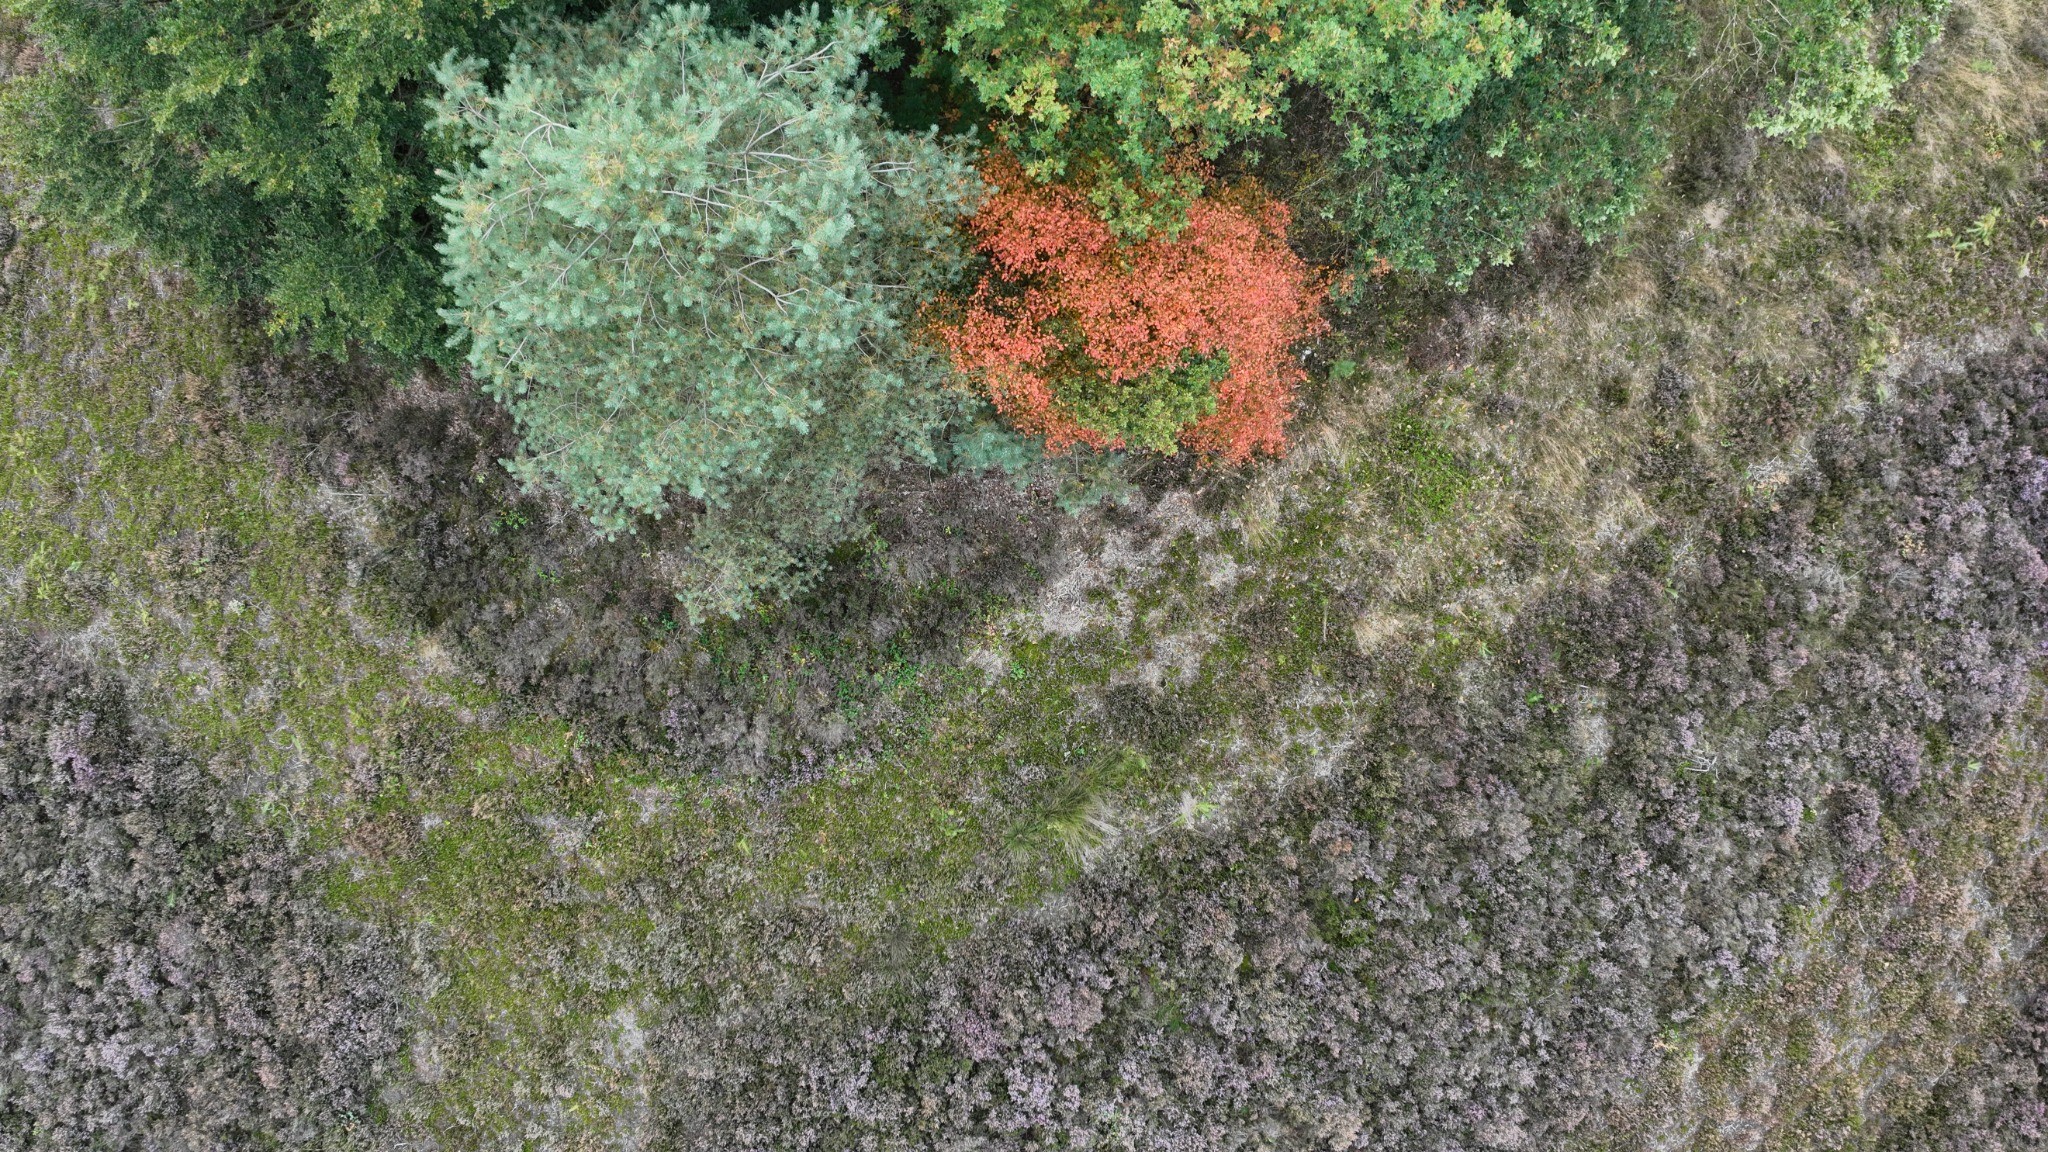
Where are saplings increasing? How much of the site has become grass-dominated? And is management delivering the intended development? Our vegetation analysis maps these changes and expresses recognised vegetation categories as percentages.
This interim assessment helps you set priorities: where action is needed, where management can continue and what change you want to see at the next survey.
A good analysis does not just record what is there…
it reveals what needs attention.”
How we analyse vegetation
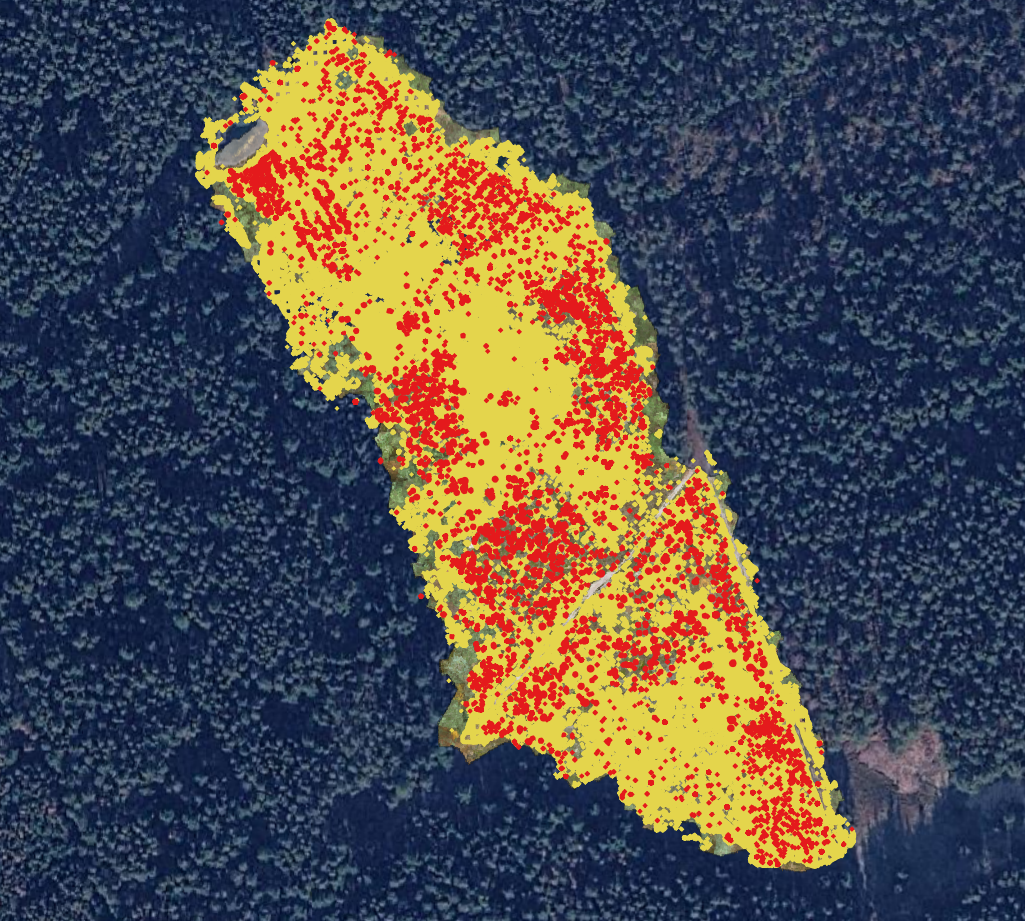
We recognise vegetation at plant level and turn the recognised categories into separate GIS layers. You can see where they occur and what percentage of the site they cover, such as grass, heather and young woody growth.
Coverage is 100% of the surveyed site. This analyses the vegetation categories we can recognise; small species and ecological interpretation remain the ecologist’s work.
What this gives you
Vegetation percentages and maps show where grass encroachment or saplings need attention, helping you deploy people and budget effectively.
Compare surveys and track development after a management measure. The consistent method helps identify changes on the site.
Reports, GIS layers and the online viewer give land managers, ecologists and provincial authorities a shared basis for planning and supporting decisions.
From vegetation map to management goal
We recognise vegetation at plant level and translate the recognised categories into maps, percentages and separate GIS layers. For example, you can see the proportion of grass-dominated areas and where young woody growth occurs.
The analysis covers the whole surveyed site and uses the same method each time. This lets you track change: how much woody growth returns, where grass encroachment increases and what changes after management.
We compare results with the relevant vegetation and structure criteria for your SNL management type. This provides guidance for management choices, contractor assignments and supporting reports or subsidy applications.
SNL is the Dutch Subsidiestelsel Natuur en Landschap, a nature and landscape subsidy scheme. Our analysis supports assessment; small species, field checks and ecological interpretation remain the ecologist’s work. The requirements of the relevant scheme remain decisive.
More about SNL at BIJ12 ↗Vegetation index · GNDVI
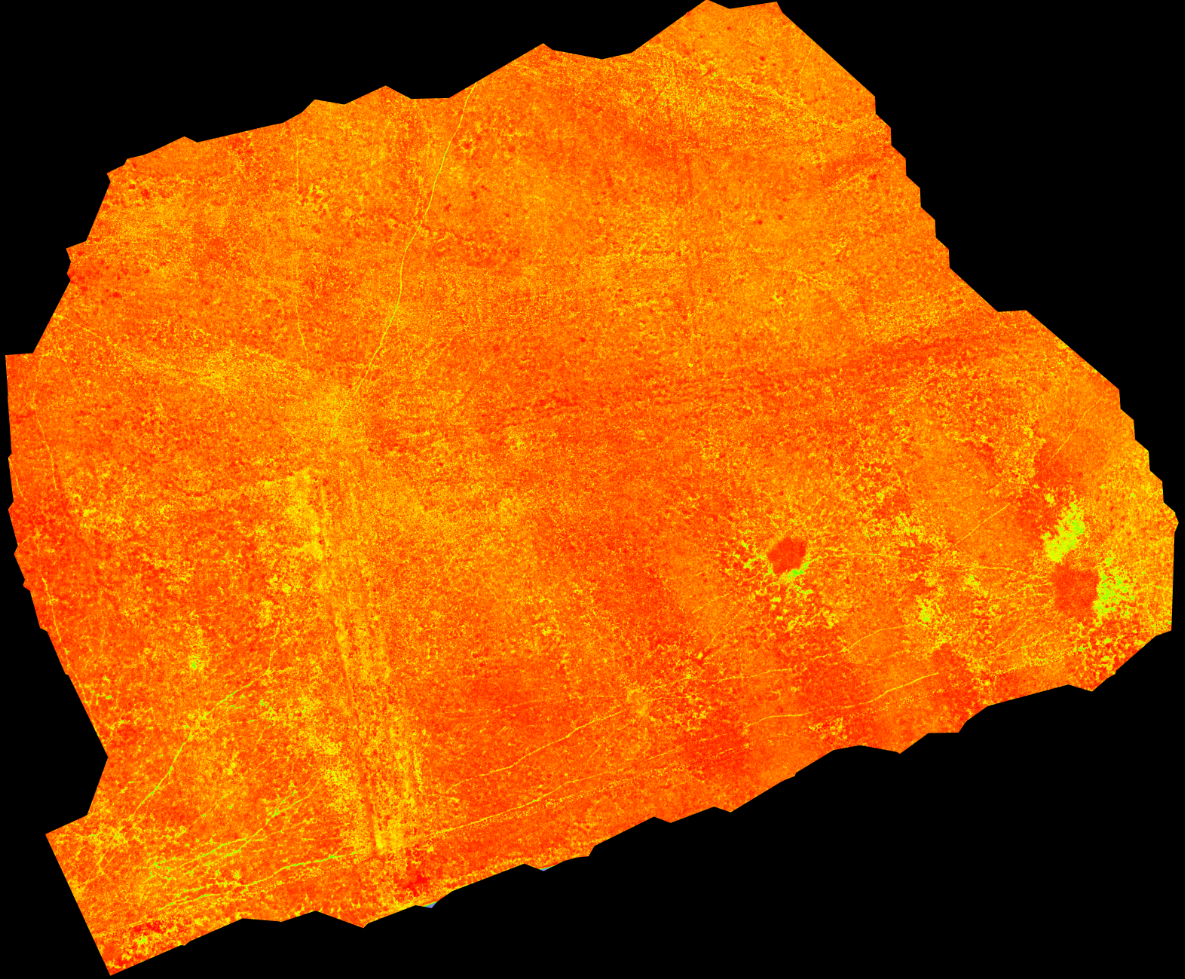
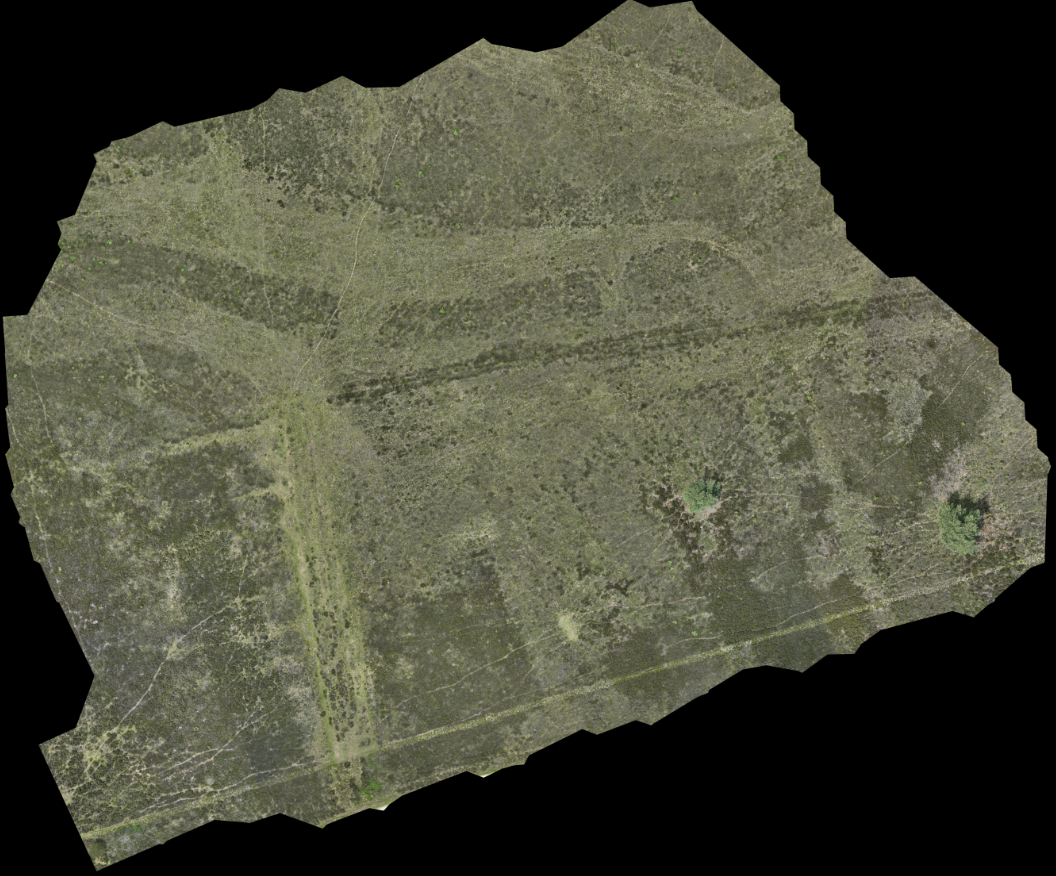
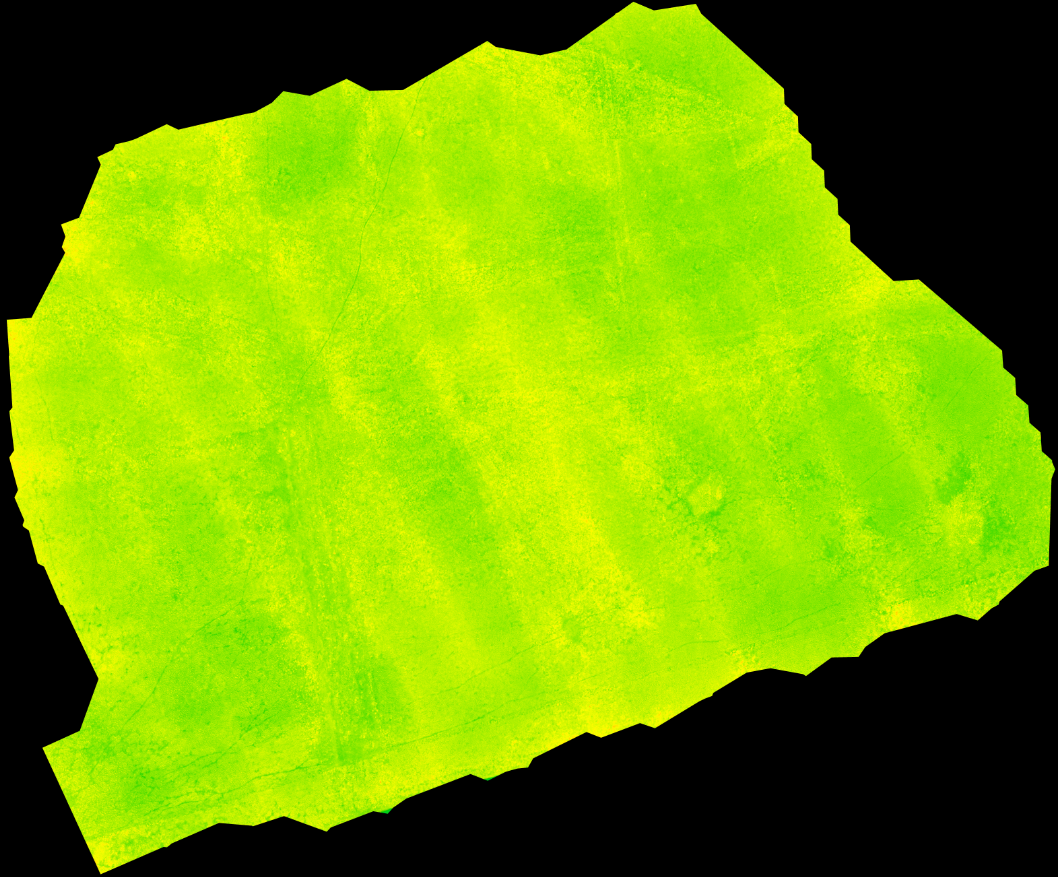
GNDVI stands for Green Normalized Difference Vegetation Index. It compares green and near-infrared light and is sensitive to differences in chlorophyll and green vegetation cover.
The map reveals differences within your site. This helps you check where vegetation is lagging and track how an area develops after management. Combined with recognition layers and field knowledge, it helps identify where more attention is needed.
An unusual value is an indication, not an established cause. Season, vegetation type and survey conditions matter. Red is the chosen display colour here; the legend and index values determine its meaning.
Move the divider to explore the difference.
Leaf chlorophyll index · LCI
LCI stands for Leaf Chlorophyll Index, which is sensitive to differences in chlorophyll. Chlorophyll plays a role in photosynthesis, the process plants use to turn light into growth.
The map helps identify unusual zones and track change, providing a reason for targeted field checks. The index is an indication, not a diagnosis of drought, deficiency or the cause of a difference.
Comparison requires comparable surveys and attention to season and vegetation type. Together with the ecologist, you translate the pattern into an appropriate management decision.
Move the divider to explore the difference.
Working with the ecologist
Our analysis supports ecologists and speeds up their work. Their expertise remains essential for recognising and reporting small species, field checks and ecological interpretation.
We offer a three-year survey cycle as a broad interim view of site development, helping you adjust towards your goals. More frequent surveys are possible.
Combining it with sapling removal? We use the new survey immediately for an updated vegetation analysis.
See the field work
See how our services support land managers.
Practical questions
A report with percentages of recognised vegetation categories and separate GIS layers. The layers are available in our online viewer, allowing you to compare the situation and changes.
No. Our site-wide analysis supports ecologists with maps and figures. Small species, field checks and ecological interpretation remain necessary. Results provide information for SNL; they are not a standalone, complete assessment of ecological quality.
Yes. We use the same analysis method each time. With comparable surveys, you can track where growth returns, how grass encroachment changes and how vegetation develops after management. Season and survey conditions are included in the interpretation.
Yes. We survey the site again for delivery, making it a practical time for an updated vegetation analysis. We offer a three-year interim assessment; more frequent surveys are possible on request.
Discover what is possible
Meet us at a presentation or see the solution during a live demonstration in the field.
Cookies at HeathClean
With your permission, we display videos and live news through three external partners. They may use cookies and process data such as your IP address. You decide what to allow. More information.
Want to change or withdraw your choice? You can do so at any time in Privacy settings.
We remember your choice on this device for six months. External processing may take place outside Europe. More information is available in our privacy notice.